
Highlights:
Burundi's low ND-GAIN score reflects the nation's standing as one of the fifth poorest nations in the world. Because over 30% of Burundi's GDP depends on agriculture, and most of the population lives in rural areas, climate change could have an extremely negative impact on its economy and human living condition, thus exacerbating its already extreme child malnutrition and increasing its dependence on humanitarian aid. This brief study illustrates the utilization of ND-GAIN as an assessment tool that highlights areas in dire need of improvement so a nation can adapt and cope with the current and future effects of climate change and other challenges.
ND-GAIN
Increases in climate-related disasters and other climate change-related stresses will lead to increased costs for governments and businesses, complicate political decisions, and threaten the quality of life, especially for vulnerable populations. Making adjustments to human systems intended to reduce vulnerability and to minimize negative impacts from climate change is referred to as climate change adaptation.
The ND-GAIN index aims to help businesses and the public sector better prioritize adaptation investments to decrease vulnerabilities in the face of global shifts such as natural resource constraints, overcrowding, and climate change.
The Index summarizes a country's vulnerability[i] to climate change and other global challenges in combination with its readiness to accept adaptation investments. A country's ND-GAIN score is composed of a vulnerability score and a readiness score. Thirty-six indicators contribute to the measure of vulnerability. Nine indicators contribute to the measure of readiness. The Index measures vulnerability using a range of indicators that reflect medium or long-term climate change impacts in six life-supporting vulnerability sectors, as well as the “readiness” of governance, economic stability and social structures. Readiness indicators suggest a country’s ability to mobilize and absorb adaptation investment. The calculation of the ND-GAIN score of a nation can be illustrated by:

Each indicator comes from a reliable public data source such as the World Bank, Food and Agriculture Organization, and the United Nations. The selection of the indicators is based on literature survey and consultation with scholars, adaptation practitioners, and global development experts. The chosen indicators must be i) actionable through adaptation, ii) consistent with current knowledge and best practices, iii) potentially downscalable from national to regional or urban, iv) directly representative of the phenomena they measure, and v) must not include broad socio-economic measures such as GDP per capita or Human Development Index. Moreover, the indicators need to be quantified at the country-level with data that: i) provide global coverage, ii) provide time-series coverage, iii) are transparent and conceptually clear, iv) are freely accessible, and v) are provided by reliable sources that carry out quality checks on such data.
BURUNDI ANALYSIS
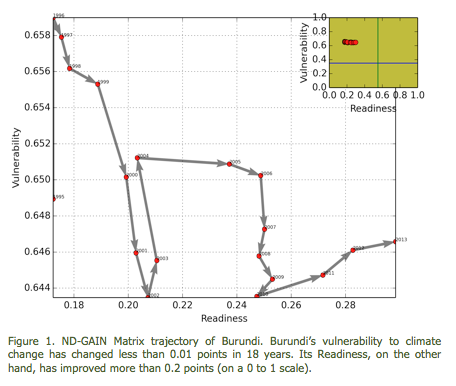
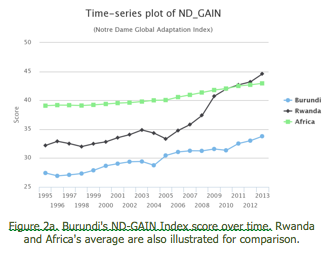
As shown in Figure 2a, Burundi’s 2013 ND-GAIN score was 33.8, putting the nation among the ten lowest scoring nations worldwide. This standing reflects its status as one of the five poorest nations in the world. While the nation's ND-GAIN score has consistently increased over the last 18 years (from 27.5 in 1995 to 33.8 in 2013), this raise was due almost entirely to improvement in the country’s readiness score; its vulnerability score, on the other hand, has remained nearly constant (unimproved) for the last 18 years. The ND-GAIN Matrix (Figure 1) depicts Burundi’s trajectory over time on a vulnerability and readiness plane.

Vulnerability
As shown in Figure 3, Burundi’s vulnerability to climate change is affected the most by its health and food sectors, corresponding to scores of 0.789 and 0.683 respectively. The high score of its habitat and ecosystems’ sectors also play a pivotal role on the nation’s high vulnerability standing. The water sector score (0.332) is the least vulnerable of all the sectors and stands below the African average of 0.571. All other areas score above Africa’s average, meaning they are more vulnerable.

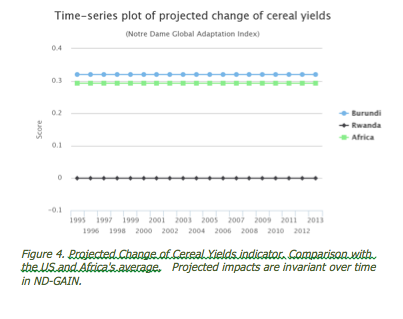
According to FAO, rice, wheat and maize make up two thirds of human food consumption. Projected change in yield of these three crops in a country is an indicator of how climate change may affect that country’s agriculture sector. According to a Representative Country Pathway 4.5 emission scenario (a measure of greenhouse gas concentration trajectories) and the application of the ND-GAIN scoring framework, by 2050, Burundi will become more vulnerable in the food sector due to decreased cereal yields (see Figure 4). Increases in cereal yields (corresponding to lower scores) are generally favorable for lessening a nation's vulnerability. Please refer to the methodology document at http://index.nd-gain.org for detailed rationale on vulnerability indicator direction and overall index computation.
 The effects of the change of cereal yields in worsening the nation’s vulnerability could be attributed to a combination of several factors, including:
- more than 87% of Burundi's population live in rural areas, which are mostly agricultural or pastoral (see Figure 5)
- this population is expected to grow from 6.2 million today to 27 million by 2050 (see Figure 8), and
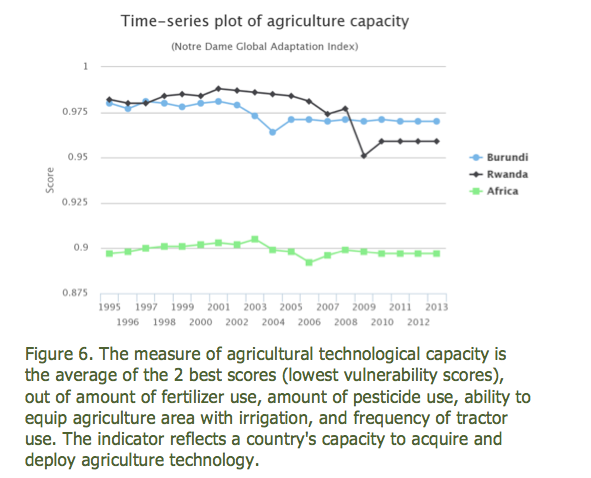
- Burundi's agricultural capacity has not progressed significantly over the last 18 years and this trend might continue (see Figure 6)
- Agriculture is the nation's largest industry, accounting for over 30% of the GDP
Although Burundi's percentage of rural population is expected to lessen (as shown in Figure 5), the rate of this decrease is not enough to lessen its high rural density, which is the cause of deforestation, soil erosion and habitat loss. These, in turn, are contributing to the chronic malnutrition of 56.8% of children under age 5. See Figure 7.


Readiness
As illustrated in Figures 1 and 9, Burundi’s ND-GAIN readiness component has improved consistently from 1995 to 2013. However, Burundi's readiness score is the 17th lowest score worldwide, at the same level of Afghanistan and Nigeria. This makes Burundi unprepared to leverage finances (from foreign investment, development funds or other sources) to build up adaptive capacity.

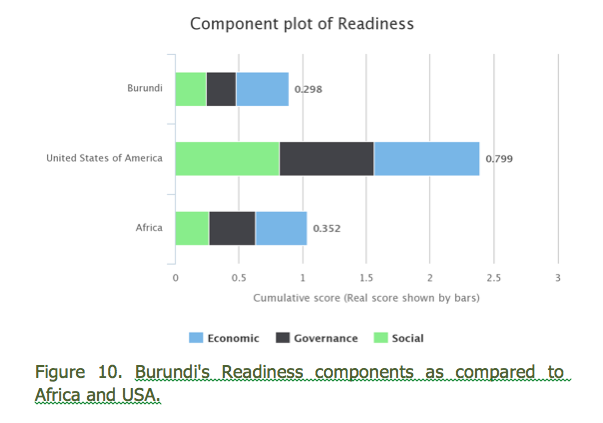
As illustrated in Figure 10, Burundi's 2013 Readiness score is impacted the most by its economic component, followed by its social and governance readiness components.
It is important to note that Burundi is landlocked and is one of the smallest countries in Africa. The country has historically suffered from warfare, corruption, poor access to education, and lack of innovation, all of which are problems that still plague the nation, as illustrated in Figures 11 and 12.

Figure 12 highlights the nation's lack of Information and Communications Technologies (ICT) infrastructure, which plays an important role in the nation’s low social score. The lack of ICT infrastructure, the basis for the provision of other ICT services, could be considered alarming at a period when technology is a tool that drives economic growth and innovation. Perhaps one of the underlying reasons for the nation’s poor ICT score is its under-dependence on electricity, as less than 2% of the nation enjoys household electricity. Similarly, its poor education indicator might play an important role in the lack of use and demand of ICT services. Burundi has an excellent social inequality score, far above Africa’s average, which might reflect its relatively homogeneous population as a result of its separation from Rwanda.

RECOMMENDATIONS
In the context of agriculture and livelihoods, we have identified Burundi's ND-GAIN sectors and indicators that contribute to the nation’s poor standing worldwide. Only two countries (Eritrea and Chad) rank worse than Burundi on the ND-GAIN Index in terms of the countries' vulnerability to climate change and readiness to adapt.
For the nation to considerably improve its capability to cope with these challenges, there will need to be adequate and prompt improvements on the indicators that are actionable in the short and medium-term, and the establishment of adequate platforms for a gradual improvement of the indicators that are actionable in the long term.
In this context, ND-GAIN’s adaptive capacity component describes the availability of social resources to put adaptation into place. Figure 13 illustrates how Burundi compares to Africa’s average and Rwanda, highlighting the adaptive capacity indicators that can be prioritized. A comparison of Burundi and Rwanda illustrates that there are four indicators that can be improved: child malnutrition, access to improved sanitation facilities, disaster preparedness, and protected biome.

Because Burundi's GDP is overly dependent on agriculture, climate change could exacerbate and complicate its already very bad economy, human conditions, child malnutrition, and over dependence on humanitarian aid. While urgent humanitarian aid will focus on the most pressing issues such as child malnutrition and health, medium and long-term international development interventions will need to focus on the provision of a stable basis for development of areas such as control of corruption and political stability and non-violence. Aid is more effective when the policy and institutional environment is "good", because aid is then more likely to be used rationally, and not wasted.
In spite of the steady improvement of the nation’s ND-GAIN readiness component and its positive effect on the improvement of the ND-GAIN score, the nation’s rate of improvement is not enough for coping with urgent issues that are complicated by climate change. Improvement in readiness components is necessary but not sufficient.
Nevertheless, given Burundi’s overdependence on agriculture, the introduction of electricity and ICTs could be a tool that helps in the betterment of education, empowerment of the citizen, and economic diversification. Indeed, given Burundi's high rural population density and small territory, the introduction of reliable electricity and ICTs is feasible under a framework that empowers the citizens, heightens education, and fosters growth of small and medium size enterprises.
Bordering nations such as Rwanda (with similar social and geo-political contexts) are able to demonstrate that better rates of improvement and considerable betterment of vulnerability sectors and indicators are also possible.
About ND-GAIN
ND-Global Adaptation Index is the world’s first private nonprofit organization created to save lives and improve livelihoods in developing countries by promoting the understanding and importance of adapting to global changes brought about by climate, population shifts, urbanization and economic development. It is the leading index showing which countries are best prepared to deal with security risks, droughts, superstorms and other disasters and is the only free and open-source index to measure a country’s vulnerability to climate change and other global forces, as well as its readiness to accept private and public sector investment in adaptation.
Decision-makers use ND-GAIN’s country-level rankings to determine how vulnerable countries are to global changes and how ready they are to adapt, thus informing strategic operational and reputational decisions regarding supply chains, policy choices, capital projects and community engagements. The Index helps leaders avoid costs, manage liabilities and build resilience. ND-GAIN also informs market expansion by identifying which countries are ready for products and services that increase adaptation. Key elements of the metrics behind ND-GAIN include water, energy and transportation availability, along with economic, governance and human health factors. The Index was created in consultation with world-class scientists, civil society representatives and business leaders. The Global Adaptation Institute was founded in 2010, and moved to the University of Notre Dame from Washington, D.C. in April 2013, becoming the Notre Dame Global Adaptation Index.
BIBLIOGRAPHY
All information encountered (including illustrations) in this document is obtained from ND-GAIN data found at http://index.gain.org. Please refer to the Methodology document found at that address for further insights on the methodology and computation of the ND-GAIN index.



 Among conference influencers, I heard many reasons against adaptation. Such projects aren’t bankable, contended the head of Regions20, a United Nations investor collaboration. Mitigation is more interesting, maintained a global nonprofit agriculture sustainability advocate. And from the United Nation’s adaptation chief: Lessening greenhouse gases is the only thing insurance companies should spend money on.
 Why is COP21 a must-attend confab for me? This is the first time that climate adaptation will be on the table for discussion. That’s a big deal. Adapting to climate vagaries – think of ocean ports raising sea barriers and drought-tolerant crops being planted in the world’s expanding arid regions – is more important than ever. Adaptation must rise to the top of the climate agenda, ignited by the 6.5 million people displaced in Syria’s drought-driven civil conflict and the 7,000 who died in the superstorm Typhoon Yolanda that hit the Philippines.
 An edifying conversation with Tom Herbstein, programme manager for the
  The
The 
 I enjoyed great conversations last week with delegates and speakers from around the world at the first Chicago Forum on Global Cities,


 attle, for instance, planners mulled how to approach climate change and natural hazards at both the local level and worldwide. The Lincoln Institute of Land Policy sponsored the planning and climate change symposia.
 The Wednesday morning panel, Urban Day: Applying Technical Research and Tools in Developing Cities, focused on lessons learned from putting urban adaptation projects in place. A top-notch panel included John Furlow, USAID; Glen Anderson, Engility Corp.; Charles Cadwell, The Urban Institute; and