Index

Buffering Against Climate Risk: Lessons for the Refugee Crisis

This blog was initially published by our partner, the RANE network:  https://www.ranenetwork.com/rane-blog/buffering-against-climate-risk-lessons-for-the-refugee-crisis/ As the world watches countless economic migrants and war refugees journey perilously from their volatile homelands to relatively stable countries that respond with tactics as varied as their histories, two overarching questions arise: How did we arrive at this stage of human suffering? And what can we do to avoid it from occurring again?

I think it is worth examining why some countries withstand stress while others don’t. In my work with the Notre Dame Global Adaptation Index, I focus on how countries adapt to the stresses and shocks of climate change. I think there are valuable lessons from this examination of climate risks to help explain why some countries are buffered from creating refuges when times get tough.

In ND-GAIN’s country index, we identify those countries that have significantly improved their economic, social or governance components (which we examine as a way to understand a country’s readiness to take on adaptation investment) and have decreased their climate vulnerability over the past two decades

There is a unique set of 10 countries who have decreased their vulnerability and increased their readiness more over the last 20 years.

While this set of countries seem more diverse than similar – different locations, government type, history and economic systems, these countries share common features, and one in particular stands out from the 46 indicators ND-GAIN examines: political stability. It turns out that the stability afforded by good governance in the form of political stability may buffering them from stress turning to crisis in the case of both climate risk and emigration.

It is interesting to examine the diversity in these countries’ approach to gaining political stability. The countries can be categorized into three groups: those who improved, those who worsened but then rebuilt and those who remained mostly unchanged.

In the first group are Rwanda, Angola, Georgia and Turkey. Each has improved its political stability since 1995. Rwanda and Angola, for instance, have made significant peacekeeping strides from their violent past of civil wars and genocides. Human rights have improved there, too.

The group of countries whose political stability worsened but then rebounded includes Saudi Arabia, Belarus and Oman. Saudi Arabia’s leader suffered a stroke, which led to an odd period of leadership. The war in Iraq and al-Qaeda’s presence in the region also affected it and led to decreased political stability. Since, however, the Saudi government has retained some of its lost political stability, which helps it prepare for climate change.

Oman also suffered from events in Iraq but made great progress since in its elections and freedoms. Belarus, which gained independence in 1991 from the Soviet Union but then endured abusive authoritarian rule, regained political stability after its people protested.

Those countries that remained mostly politically stable in the past 20 years include Uruguay, Mauritius and the United Arab Emirates. While they experienced quite a bit of change during this period, they dealt with it within their current political system, and this has led to their success in climate change preparedness.

As Rockefeller Foundation President Judith Rodin notes, “… it’s what doesn’t happen that proves success. When disruptions do not become disasters, we’ve won. When a community is resilient and stays strong in the face of a crisis, (we) mark a victory.”

These 10 countries, then, may well hold lessons to today’s heart-breaking emigration from Syria and elsewhere. In the 10, we see political stability as a buffer to the shocks and stresses of climate change — and perhaps as well to the tragedy of exodus from them.


Countries whose vulnerability to climate change, other global challenges decreased while readiness to improve resilience improved. (Top 10 out of 182)

Country ND-GAIN Country Index Score Improvement 1995-2013
United Arab Emirates 16.06
Saudi Arabia 13.98
Turkey 12.56
Rwanda 12.24
Oman 12.04
Georgia 11.23
Mauritius 11.11
Angola 10.85
Uruguay 10.65
Belarus 10.56


Joyce Coffee is managing director of the Notre Dame Global Adaptation Index (ND-GAIN). 
Unsung Heroes – Government Statisticians Who Need the Space to Be Honest

At a Social Capital Markets SOCAP 2014 panel in San Francisco in Fall 2014 about Resilience Investing Informed by Global Data I had the pleasure of presenting with Dr. Mirza Jahani, the CEO of the Aga Khan Development Network’s U.S. foundation.  The panel focused on data and the particular issue dealt with how to spend less money gathering data and more money using it to achieve better outcomes. SOCAP-14-Logo-1Dr. Jahani’s response – consider government statisticians – made me realize we may be looking at the solution right under the world’s green eye shade. Government statistics bureaus around the world offer treasure troves of both fine statistician and copious amounts of data (much of it on paper – the topic of a future post). These number crunchers know the issues confronting their countries intimately, both quantitatively and qualitatively, from their life experience and work. But they lack the resources to make those data transparent.

As many know, I’m a big proponent of free and open-source data.  But, perhaps I need to shift my emphasis. What if these government statisticians could say what actually was happening in their respective countries and share the data they have gathered directly and without intervention (regardless of the inference the world would draw from it)?    The prevailing belief is that many government statistics are suspect, because some countries lack capacity to gather or verify data and/or countries want to appear better (or sometimes worse) than they are for political or investment purposes.

If they possessed the clout so they could be honest with government data, we users could even say, “This data isn’t bad; let’s use it.” This would save implementers in every sector valuable time and money they can apply to their work on the ground.

From Dhaka Bangladesh to Kathmandu Nepal, from Chicago, USA to Aberdeen, UK, cities have opened up their data to the world, and even inspired titles for appointed posts. Consider “Chief Innovation Officer.” As a result, these enlightened governments gain the reward of better decisions made from better data and also reap a reputational boost for their transparency from citizens, other cities, and businesses and other institutions.

More governments should take a page from this book on how to manage a reputable statistics bureau. They then would empower their statisticians and data miners to give the world their most powerful currency: data.

Index Inquisition, Incursions, Insides, Insights

Earlier this month, the Economist warned about the vagaries of Index.  I’ve written about this, too.  And I agree we must be careful about reading too much into Index.  But, as a journalist who interviewed me recently pointed out, “Journalists love them,” and in the Economist’s case, that seems to be true. Following on its November 8 article, the Economist’s next issue carried an article on sexual harassment in Canada and referenced the World Economic Forum’s rankings of countries by gender inequality. In yet another article about growing globalization, the author cited the DHL Global Connectedness Index.  I’m an eager consumer of the Economist and, in each issue, I run across about two index references (not to mention the favorite worldwide index:  The Economists’ Own Big Mac index).

I’m proud to say that ND-GAIN gets it right, according to the Economists’ 1, 2, 3 guide to better international country rankings: We don’t tweak the weightings to suit, don’t substitute data when a country is lacking it, and use only data globally available, national in scope and verifiable. We publish our full methodology (and all of our data and framework too) free and open to the public.  We raise caveats and describe our choices in this document.  We agonized for 18 months over what to put in our index and sought our indicators from the literature and from experts in the field.

With ND-GAIN, we are eager to catch people’s attention and make information easy to process.  The Economist notes that “ratings and rankings can be powerful tools of both branding and influence.” They can help shape new policy.

We’ve just released the 2014 version of the Index and have made improvements, such as opting for

  • Consistent terminology in vulnerability sectors so that a single definition of exposure, sensitivity and adaptive capacity applies across all sectors.
  • Distinction among sectors and vulnerability components to minimize conceptual overlap within the Index; e.g., the combination of energy and coastal infrastructure under a single infrastructure sector.
  • More flexibility for downscaling portions of the Index to allow integration with Geographic Information Systems.
  • Equal weighting between all sectors (vulnerability) and components (readiness).
  • Responsive to user feedback in adjustments to indicators of economic readiness.

We’ve also made it easier for those Economist journalists (and others!) to use:

ND-GAIN’s web-portal. It now includes new computational tools to facilitate ease of use, to allow more data visualization and to enable tracking individual indicators and country grouping, including the:

  • Ability to visualize each indicator, sector and area on line graphs and spider graphs.
  • Ability to graphically compare indicators, sectors and areas of two nations or groups of nations.

Capability to download all indicators, sector scores, and ND-GAIN scores.

Corporate Adaptation Stories: Risky Business

With mid-term U.S. elections less than two months away, I have been scanning the news eagerly to locate any references to the significant Risky Business Project report on climate change released in June. I wondered if the report’s critical findings have stoked any passionate fires within any elected officials or their opponents. Alas, political contests this year don’t seem to rest on the future of our country – or any of its political districts – as far as the effects of climate change are concerned.

What a shame. Reflecting its remarkable array of leaders on its advisory board, Risky Business has a well-thought-out strategy: Engage influencers from both sides of the political aisle, inform them with potent data that illuminates how climate change is impacting key sectors of the U.S. economy, and then get them to prod their powerful networks to move on mitigating the effects of pollution and other environmental dangers.

When lawmakers grasp that message (if they ever do), then climate change will move to the front burners and, hopefully, lead to ways to counter the effects that Risky Business convincingly demonstrates already are impacting crime, food, health, infrastructure and other vital sectors.

The report notes that the project aims to highlight climate risks to specific business sectors and regions of the economy and to provide actionable data at a geographically granular level for decisionmakers. “Right now, cities and businesses are scrambling to adapt to a changing climate without sufficient federal government support, resulting in a virtual “unfunded mandate by omission” to deal with climate at the local level,” the report maintains. “We believe that American businesses should play an active role in helping the public sector determine how best to react to the risks and costs posed by climate change.”

Recently, the Columbia Journalism Review asked, “Has Climate Change become a business story?” It observed that The Wall Street Journal and the Financial Times published stories ahead of the report’s release. In addition, leading business publications, including Forbes, Fortune and the International Business Times, ran high-profile articles on their websites the day of the press conference.

Steven Mufson, an energy and finance reporter, wrote about it for The Washington Post, and the Los Angeles Times’ report ran in its Business section. Long-time National Public Radio economics correspondent John Ydstie covered the news and The New York Times was one of the few that covered the event as a science story.

But I’m looking for a different story – one from the corporations themselves – with business leaders talking about their own climate-risk adaptation stories, perhaps galvanized by this report,

In two weeks during New York City’s Climate Week, ND-GAIN will host an event, What’s New:  Corporations Leading Climate Resilience around the World, where corporate officials will relate their story by unveiling the latest innovations in adaptation.

Come meet the winners of ND-GAIN’s Corporate Adaptation Prize and join them and the judges for a lively discussion addressing food security, water access, health, and infrastructure solutions in the face of a changing global climate.

And, of course, kudos to Risky Business for getting the influencers to shape the biggest change crisis of our time.


Measuring Country Resilience

For the past several months, my colleagues and I have heard a lot more about both adaptation and resilience*, especially in discussions with ND-GAIN’s corporate users.  This guest blog, by ND Global Adaptation Index's Chen Chen, offers insights into resiliency particularly in the Association of South East Asian Nations. To measure countries’ resilience to rebound from adverse impacts of climate change, ND-GAIN focuses on the adaptive capacities of five sectors that provide communities with life-supporting assets and social services:
  • Food
  • Water
  • Public health
  • Ecosystem service
  • Human habitat.

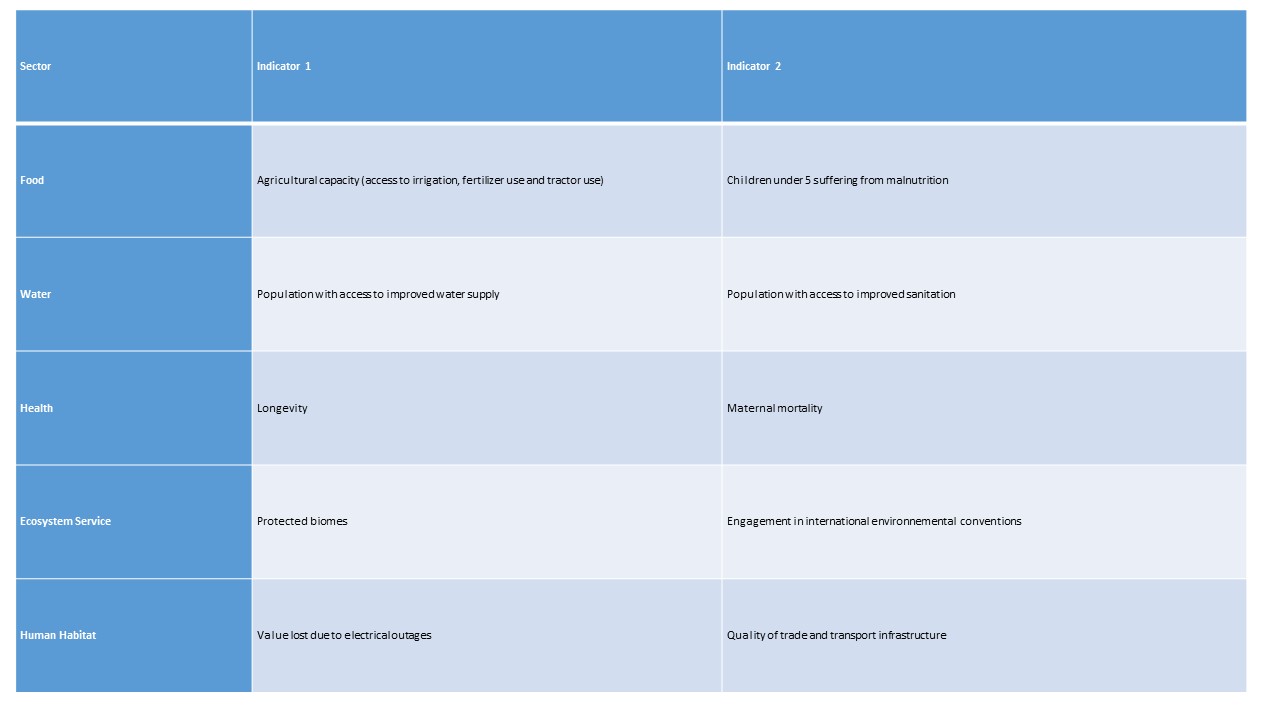
Chosen indicators reflect capacities that make social systems persist in a changing climate, based on historical data that scores countries’ performance in each of the five sectors. For instance, in the food sector, countries with a high rate of child malnutrition will possess low resiliency if climate-induced events strike the food-production system. In the ecosystem service system, countries’ engagement in international environmental conventions, such as the International Plant Protection Convention, shows a political willingness to commit to sustainable development and a technical capacity to take actions to ensure the proper functioning of ecosystems. Table 1 illustrates the set of indicators ND-GAIN uses to measure resiliency within these sectors:

Table 1 Indicators of Adaptive Capacity Measuring Resiliency to Climate Change


ND-GAIN analysis over the last 17 years finds that when these indicators are analyzed for 177 countries, lower-income countries will require a century to reach the level of resiliency of OECD (generally upper-income) countries.

ND-GAIN data also helps examine regional resiliency.  For instance, ASEAN has been improving its resiliency to climate change over time from 1995 to 2012. In particular, it has made rapid progress in enhancing resiliency in water and health sectors by strengthening capacities to provide quality services in these areas. See Figure 1.

Standardized scores over time (0 indicates lowest resiliency and 1 indicates highest) for resiliency sectors in Association of Southeast Asian Nations (ASEAN).

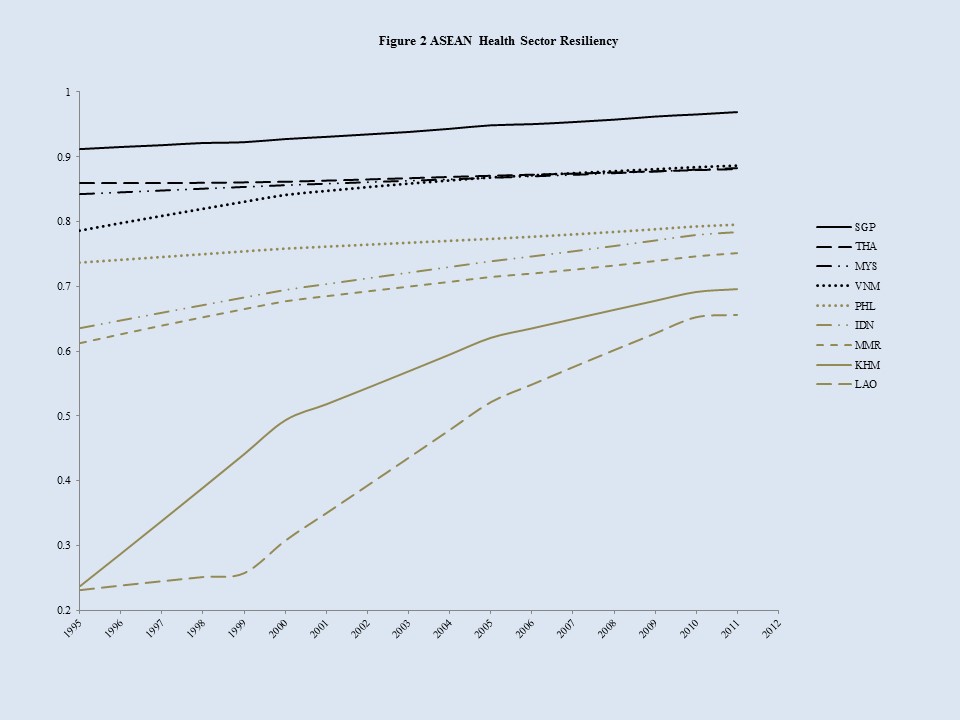
Each country’s performance contributes to the trend of increasing resiliency. As illustrated in Figure 2 and considering the health sector, Singapore posts the highest resiliency and continues that strength, while Cambodia and Laos have show more improvement, relatively. In particular, Cambodia displays the highest rate of progress among nine ASEAN countries, contributing greatly to ASEAN’s overall health-sector resiliency improvement. Still, Cambodia and Laos, perhaps, will  require decades at current rates to reach to the current level of resiliency in Singapore.


By analyzing our data to better understand resilience, ND-GAIN helps decision makers inform their supply chain, capital asset, community engagement and policy decisions with the future of lower-income countries in mind.

*Resilience: The capacity to recover quickly from difficulties (Oxford Dictionary)


Presidential advisors Podesta & Holdren: Consider how we’re unleashing data power on climate change

The Internet buzzes with the ambitious plan* by White House advisors John Podesta and John Holdren to create easy-to-use tools to prepare people to be more resilient to climate change.  But, hey, we’re already doing this for the world – employing half-a-million data points in an interactive assessment of 177 countries that uses this framework: And our data, methodology and framework are free and available for anyone to see and use.


Here’s an ingredient in our not-so-secret sauce: We include readiness. We believe decision makers need to know what’s occurring in the government, economic and social sectors to make the vulnerability information truly actionable.  Because corporate decision makers don’t look at climate change in isolation, we include climate and other variables in our set of vulnerability indicators.  Human health, human habitat, water, food, ecosystems and infrastructure variables round out our description.


We aim to keep it simple and easy to use, drawing the user in initially with a relative rank of geographies.


Then, we provide detailed information about each geography, including the variables most at risk:

Consider these ways this framework can raise awareness and inform decision-making by turning climate risk into opportunity for action.

Supply chain risk: Plot the major assets in your value chain on a matrix of relative vulnerability and readiness, and discover your major risks and opportunities for investment:

Investment decisions: Do you possess a product that helps increase resiliency? How about infrastructure, pharmaceutical or building technologies? Compare several geographies to one another to determine relative areas of risk – energy sensitivity for one, health-care workers per capita for another.

Setting development priorities: Exploring opportunities to expand your operations in a new location?  What variables matter most?  Roadway infrastructure, an educated workforce?  Data here, all in one place, will inform your next steps.

Good luck with this super important effort, Messrs. Podesta and Holdren.

We commend you for your work to unleash the power of data on climate change adaptation and resiliency.

Read about our methodology here, and contact us for more info!

* http://www.whitehouse.gov/the-press-office/2014/03/19/fact-sheet-president-s-climate-data-initiative-empowering-america-s-comm


Poor Countries Are Losing Ground in the Race to Adapt to a Changing Climate

The World Economic Forum released their 2014 Global Risk Report with a write up crafted by WEF’s Global Agenda Council on Climate Change based, where Juan Jose Daboub (the Global Adaptation Institute’s founding CEO) is co-chair.  I drafted the original write up which resulted in this piece: The year 2014 is likely to be crucial for addressing climate risks, a point made by United Nations (UN) climate chief Christiana Figueres at the Warsaw Climate Change Conference. Countries made only limited progress on issues such as emissions reduction, loss and damage compensation, and adaptation. Greater progress is urgently needed to create incentives and mechanisms to finance action against climate change while efforts are made to keep temperature rise below 2 degrees Celsius.

Even as governments and corporations are called upon to speed up greenhouse gas reduction, it is clear that the race is on not only to mitigate climate change but also to adapt. Droughts, super-storms and other natural disasters are increasingly causing systemic risks around the world.

Failure to adapt most strongly affects the most vulnerable, especially those in the least developed countries. They tend to lack the infrastructure and capacity to deal with extreme droughts and floods, reduced crop yields and increased stresses on energy and water supplies.

According to the latest Notre Dame-Global Adaptation Index, it will take more than 100 years for the world’s poorest countries to reach the current adaptive capacity of higher-income OECD countries. The World Bank estimates the cost of climate change adaptation for developing countries at US$ 70-100 billion per year through to 2050.

Gradually, however, promising models are emerging of collaboration between the public and private sectors and civil society to strengthen resilience to climate change. An example is the US$ 3 billion Southern Agricultural Growth Corridor of Tanzania (SAGCOT), intended to create the infrastructure to nurture new value chains. Through techniques such as rainwater harvesting, efficient irrigation and crops that can produce more nutrients for the same input of water, SAGCOT aims to increase food production in a way that is both environmentally sustainable and benefits small-scale farmers and the rural poor.

Such innovative and ambitious projects, unlocking investment funds through public-private partnership, showcase the kind of multistakeholder collaboration that will be needed across all sectors to meet the twin priorities of climate change mitigation and adaptation.

Sources

ND-Global Adaptation Index http://news.gain.org/post/69787249752/2013-nd-gain-data-show-worlds-poorest-countries-lag

Scherr, S. J., J. C. Milder, L. E. Buck, A. K. Hart, and S. A. Shames. 2013. A vision for Agriculture Green Growth in the Southern Agricultural Growth Corridor of Tanzania (SAGCOT): Overview. Dar es Salaam: SAGCOT Centre. Available at http://www.ecoagriculture.org/documents/files/doc_483.pdf

World Bank. 2010. Economics of Adaptation to Climate Change: Synthesis Report, Washington DC: World Bank. Available at http://climatechange.worldbank.org/sites/default/files/documents/EACCSynthesisReport.pdf


Turn Tragedy in the Philippines to Adaptation Action

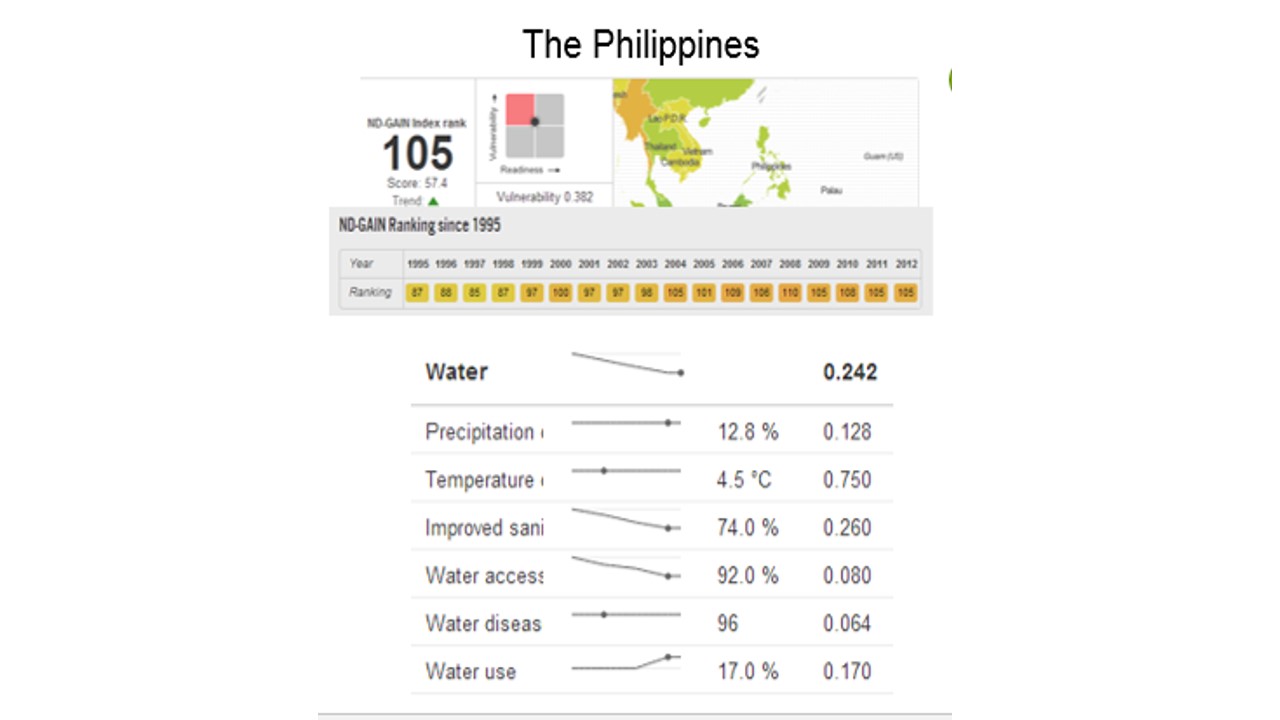
I mourn with my Philippine kaibigans about the incalculable death and destruction wrought by Typhon Haiyan on that beautiful country and its people.  I lived and worked in the Philippines in the mid-1990s while at the U.S. Agency for International Development. I consider the country my second home.  I feel a deep sadness that so many lives were lost. Yet, I do not feel hopeless.  I know that  ways exist to increase the Philippine’s resiliency, and the solutions lie within the country, the corporate sphere and the development community. When a climate-related disaster strikes, I turn to ND-GAIN to help provide me with answers to how to prevent future calamities.   It probably isn’t a surprise to those who have seen the Haiyan destruction that the Philippines ranks 99 of 176 countries on the ND-GAIN index..  When looked at from the perspective of the country’s vulnerability to climate disruption and its readiness to adapt, it is in the highly vulnerable and not-ready quadrant of the Readiness Matrix. It possesses a great need for investment and innovation to improve readiness as well as a great urgency for action.

Since 1995, however, the Philippine’s’ relative GAIN score has headed in the wrong direction, initially ranking 87th of 176 countries.   Several factors related to ND-GAIN account for this deterioration, including the growing perception that political unrest will trigger a destabilized government or an actual coup by unconstitutional or violent means. Other factors: its rate of population growth in urban centers and the natural-disaster risk for populations living in cities of more than 750,000 people.  If they reflected awhile that they rank with Burundi, Cote d’Ivoire and Iran in terms of their political stability and nonviolence score, they might strive to strengthen the institutions that hold the government accountable.

Several initiatives could help the Philippines in the near and longer term.  First, simply assume that decreasing the country’s exposure to extreme events involves reducing greenhouse gas emissions, and that the Philippines always will lie in the eye of the storm during typhoon season regardless of the extent of climate change.

The real opportunity lies in decreasing Filipinos’ sensitivity to climate disruption, increasing their adaptive capacity and boosting their economic, social and political readiness. These will increase their resilience and keep them on a path to market growth, human thriving and a caring and outward-looking world view for which they’re famous.

Based on ND-GAIN, here are three places from which to start. None are easy, but all generate hope for both the Philippines and the global community:

  • Shore up the political stability of local, regional and national government.
  • Increase the percentage of paved roads to trigger more expeditious travel on islands within the archipelago during the monsoon season.
  • Improve sanitation facilities and access to water to strengthen the population and decrease disease while freeing up community energy for commerce.

The Philippines is nababanat, or elastic, as well as resilient, and Filipinos face many more typhoons ahead.  Working together, we can save lives and improve livelihoods there and in other vulnerable regions.  As an adaptation professional deeply immersed in questions of how, I employ ND-GAIN to guide the way.


National Security: A driver for climate adaptation prioritization?

I got involved in the corporate sustainability space through civil conflict. In Vietnam, actually, while investigating innovations in water infrastructure service delivery sparked by a community fight over access to water in Haiphong. That escalated into a major conflict that left two water workers dead before the People’s Committee came to its senses and considered a new way to approach fair water access. That was two decades ago. Yet that question of water and conflict continues to erupt and spill over from small-town skirmishes to all-out wars.  Noted journalist Tom Friedman has written about it in an April 2012 column, The Other Arab Spring, and a May 7, 2013, column, Postcard from Yemen. And I’m hearing rumblings from my Notre Dame colleagues who suggest a rear-view mirror look at Darfur reveals that the conflict that forced people off their land was less about sectarian strife and more about lack of access to water. My colleague Peter Annin has written a book with the provocative title of “Water Wars.”

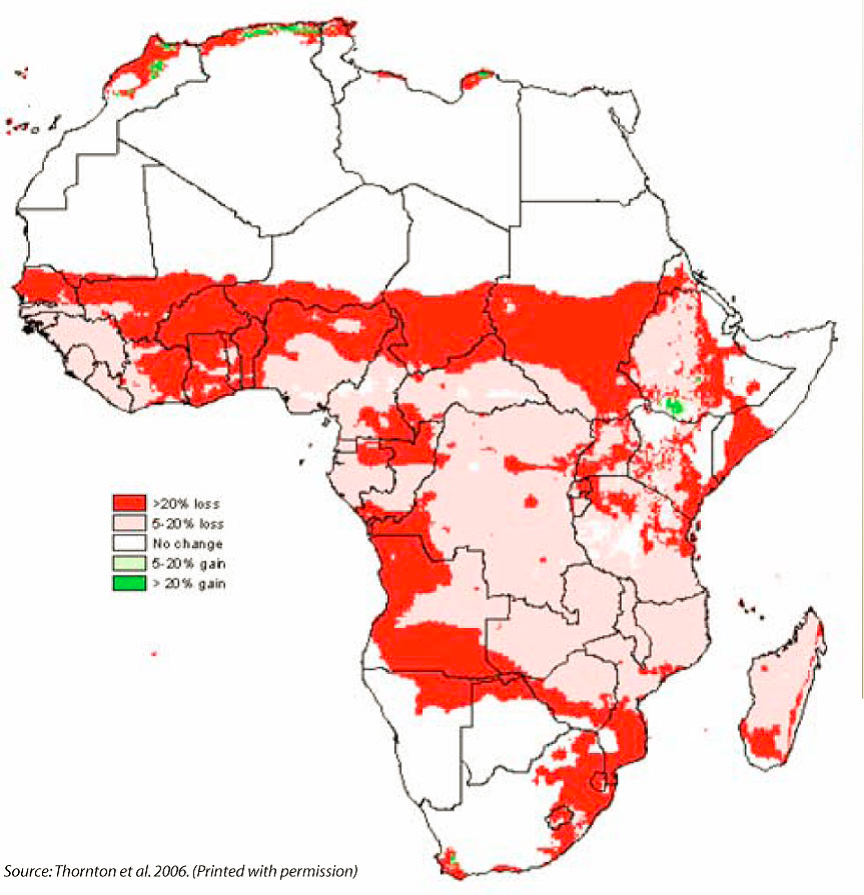
When I think about water conflict, though, I ask myself if we know more now than we did about the relative vulnerability to water risk. It turns out that we do know a lot more.  For instance, examining countries on a short fuse in water-stressed regions of the world through the ND-GAIN index, it’s apparent that the Sahel and the Horn of Africa both show significant water vulnerability. Indicating that are such barometers as the projected change in precipitation and percent of population with access to improved water supply. Their vulnerability could possibly be having an impact on other  susceptibilities, such as food and health and wellness.

It is plausible that climate change is causing internal and cross-boundary migration that is affecting security around the world. At the recent New York Climate Week, Brigadier General Steven Cheney, CEO of the American Security Project, noted that 70 percent of global militaries consider climate change a threat to security.  He identified regions such as S. Asia Bangladesh, India and Pakistan, Mali and the Middle East as “tinder boxes” for various  reasons that concern flooding and drought, which are triggering competition for resources.


The U.S. military is taking a close look at this. A 2011 Defense Department Report,  “Trends and Implications of Climate Change for National and International Security,” firmly recommends to “institute water security as  a core element of DOD strategy” since “the availability of water underlies all other elements of human security.”

Percent changes in length of growing period changes to 2050.


So what  specifically do you analyze and consider to determine if a war or significant conflict is caused by climate change?   One approach involves looking at countries that are less vulnerable, or that have become less vulnerable over time, than their neighbors or peers and measure the degree of conflict in them.  In Africa, according to ND-GAIN, countries like Tanzania and Zambia have become less vulnerable over time.

The upshot? Investing in adaptation could be one way to mitigate civil conflict.

Post Script October 23. 2013.  Thanks to Josh Foster - a wiki of all things climate adaptation - for sharing the following with me from Science:

QUANTIFYING THE INFLUENCE OF CLIMATE ON HUMAN CONFLICT

A rapidly growing body of research examines whether human conflict can be affected by climatic changes. Drawing from archaeology, criminology, economics, geography, history, political science, and psychology, we assemble and analyze the 60 most rigorous quantitative studies and document, for the first time, a striking convergence of results. We find strong causal evidence linking climatic events to human conflict across a range of spatial and temporal scales and across all major regions of the world. The magnitude of climate’s influence is substantial: for each one standard deviation (1σ) change in climate toward warmer temperatures or more extreme rainfall, median estimates indicate that the frequency of interpersonal violence rises 4% and the frequency of intergroup conflict rises 14%. Because locations throughout the inhabited world are expected to warm 2σ to 4σ by 2050, amplified rates of human conflict could represent a large and critical impact of anthropogenic climate change.

Science 13 September 2013: Vol. 341 no. 6151 1235367


Bullish on the Resiliency of Emerging Economy Cities

Bullish on the Resiliency of Emerging Cities

At NYC Climate Week, Rockefeller Foundation President Judith Rodin and SwissRe  Chairman Philip Ryan agreed that cities in lower-income countries had bettered their developed peers in their pluck for climate resiliency.  “I’m bullish on the resiliency of emerging cities, which show no fear in taking on adaptive innovations and collaborations that are making them more resilient to current and future climate changes,” Rodin noted.

As Ryan pointed out, while there is “nothing more challenging” to his business than climate change, innovative public/private initiatives are poised to present innovative ways to manage just that.  And growing city populations in lower-income countries stand to gain a great deal from the leadership their cities are displaying in adopting cutting-edge solutions.

Many city-related institutions possess an unabashed focus on Adaptation.  The climate leadership group C40 Cities has introduced an adaptation initiative lead by Mandy Ikert, its director of Water and Adaptation. The Urban Sustainability Directors Network emphasizes climate adaptation and resilience. And don’t forget the impressive impact the Rockefeller Foundation has made by raising the adaptation question to thousands of cities, more than 800 of which already have applied to its “100 Resilient Cities Initiative.”

In itsWealthier, Healthier Cities”report, produced in partnership with the Carbon Disclosure Project and C40,AECOM – the global provider of professional technical and management support services – suggests that climate adaptation is a competitive advantage. The report praises the impressive leadership that local governments have taken to spotlight the collateral benefits of climate adaptation for all sectors.

Of course, cities are hotbeds of competition. Management consultancy A.T. Kearney, which produces a resilient cities outlook every year, notes that New York, London, Paris and Tokyo remain today's leading cities. But an analysis of key trends in emerging cities suggests that Beijing and Shanghai may rival them in a decade or two.

Consider what’s happening in Quito, Ecuador.  Its climate-change strategy, formally approved four years ago (Oct. 2009), reflects the number of landslides, floods and droughts the steep-sloped Andean city of 2.1 million residents experience as well as the shrinking of the nearby Antisana glacier.  The push for the strategy actually began in 2007 when Quito hosted that year’s Clima Latino, a regional climate-change conference.

Quito’s strategy includes both mitigation and adaptation initiatives.  Its adaptation program centers on ecosystems and biodiversity; drinking water supplies; public health; infrastructure and power production; and climate risk management. The report draws on global climate models by the Intergovernmental Panel on Climate Change for impacts at similar altitudes and latitudes as Quito. The city has invested nearly $350 million so far in adaptation, using a blend of municipal dollars, international aid and philanthropic funding. In addition, Quito has moved climate adaption into the city’s main development agenda, report outside researchers.

While ND-GAIN ranks country level vulnerability and readiness, future plans include a downscaling of the Index, and cities may be our next target.

Like corporations, cities are adapting every day, and it is refreshing to know that cities in the developing world are reaping the rewards of nimble and innovative approaches to climate-change adaptation.  Their residents are fortunate to have the protection that this preparation affords. Why? Because although avoided costs are harder to quantify at a local level, the billions of dollars spent recovering from climate-related events worldwide serve as an important reminder of the need to act.

Ranking Country Sustainability for Investor Decisions

As we know, decision–makers rarely if ever look at climate risk in isolation, which is why I’m glad that Marc Klugmann brought another great article from Fast Company’s Ben Shiller to my attention.  Mark is a founding strategic advisor to GAIN, and thus he is on the lookout for other indices that rank country vulnerability. RobecoSAM offers us a good one and a reminder of the importance of looking at a chromatic list of indicators when making sustainability decisions.

The article,The 59 Countries That Are Most Prepared To Handle An Uncertain Future is particularly interesting to us at ND-Global Adaptation Index, where we are currently pouring over 2012 data in preparation for launching the 2013 index in December. Comparing their index to ND-GAIN’s 2011 data we see that there is a great deal of consistency.  For instance eight out of ND-GAIN’s top-ten are in their top ten (The difference ND-GAIN includes New Zealand and Ireland in our top ten, not Canada and US).

ND-GAIN – which includes measures of governance, economics and society along with health, infrastructure,water, etc. and RobecoSAM’s sustainability data are complimentary and help corporations, governments, and charitable organizations prioritize investments in:

  • New Markets, Products & Services
  • Targeted Development
  • Risk Mitigation
  • Corporate Social Responsibility

Ultimately, indices like these help address crucial investor questions, such as:

  1. Are you solving a big problem, preferably one that is worth a lot of money and is recognized today?
  2. Is your solution differentiated, compelling and sustainable?
  3. Does your venture have an understandable and relevant business model given your solution and the problem it addresses?

Stay tuned for a blog post next week that digs into some of these questions from the perspective of adaptation risk.